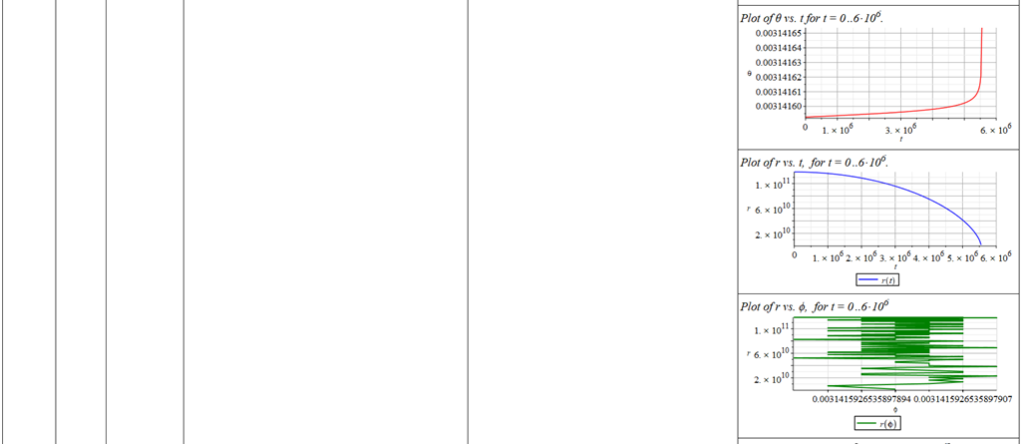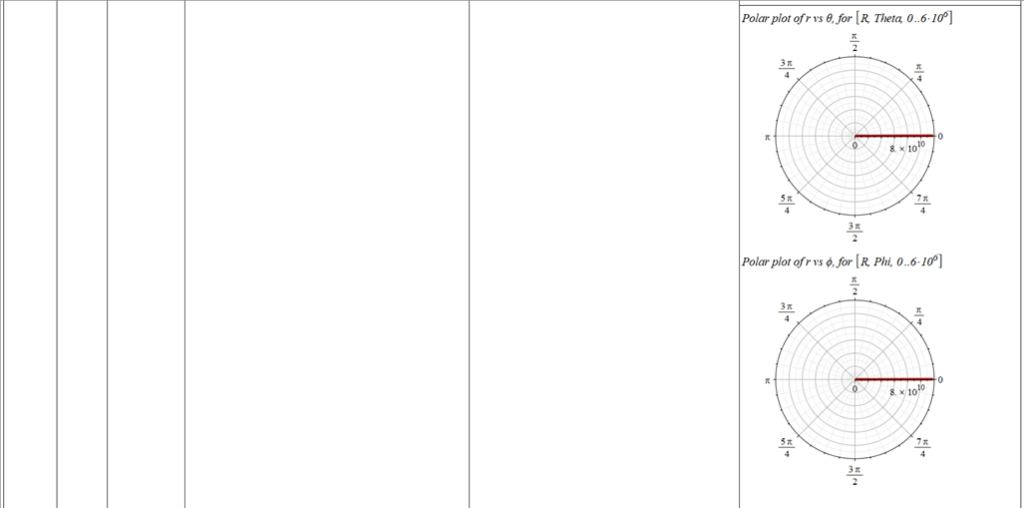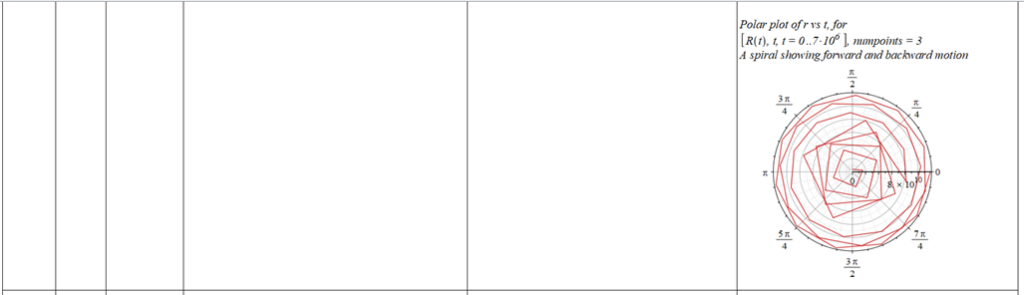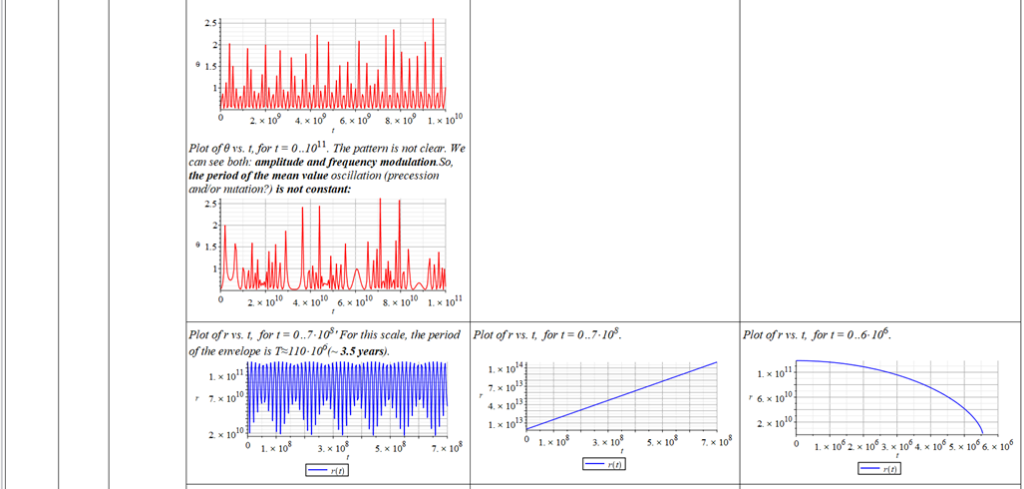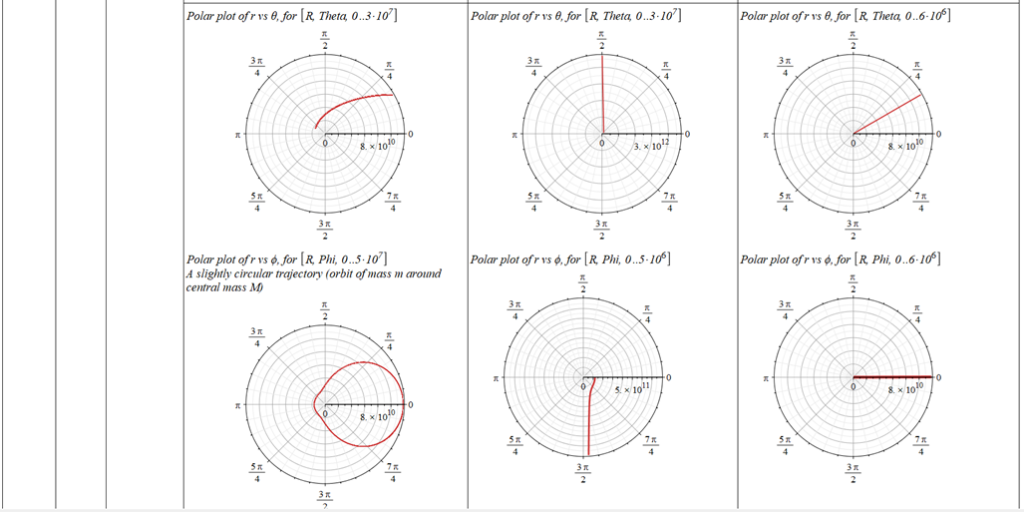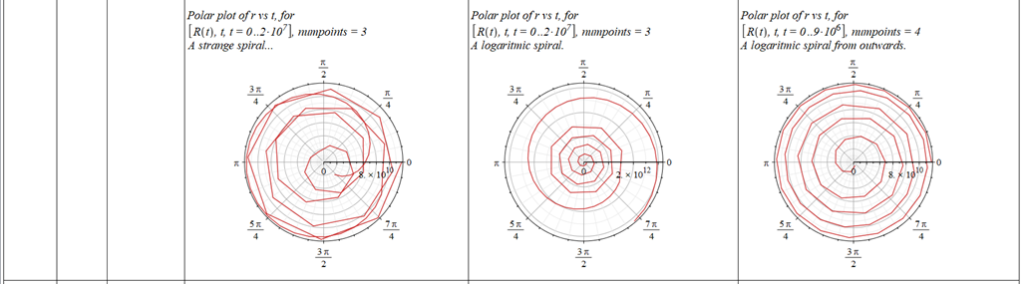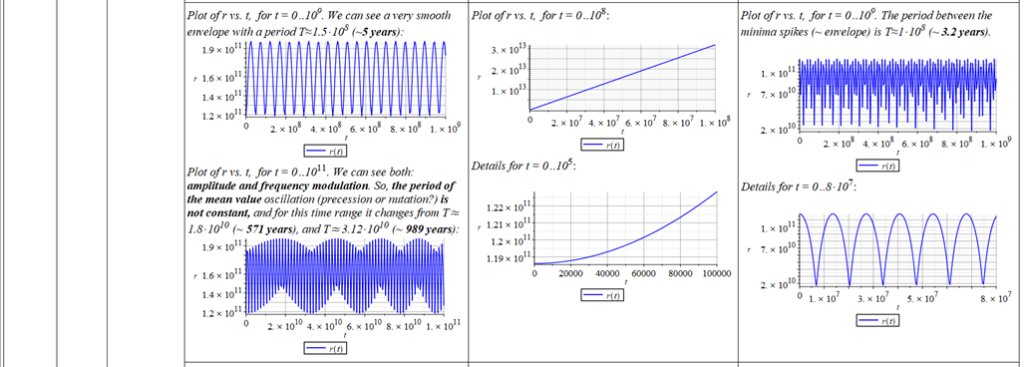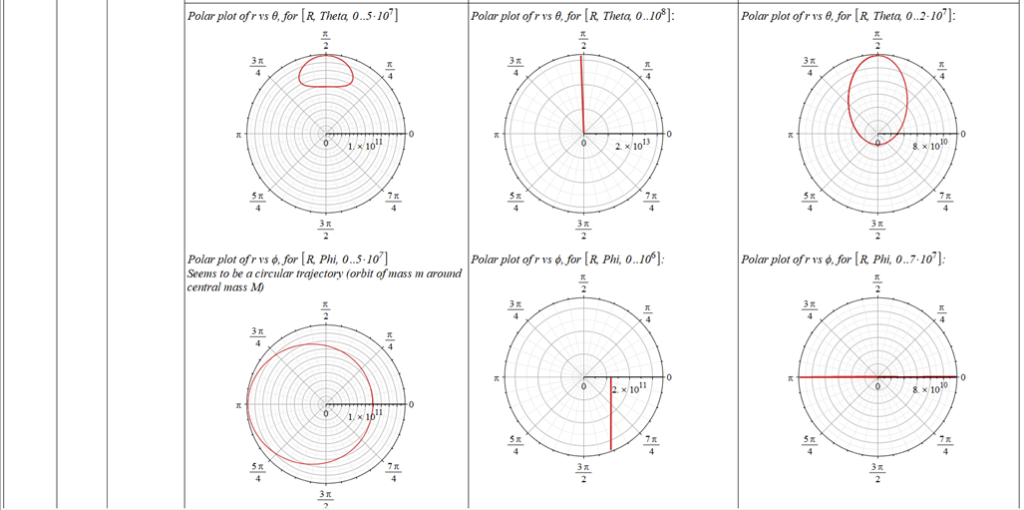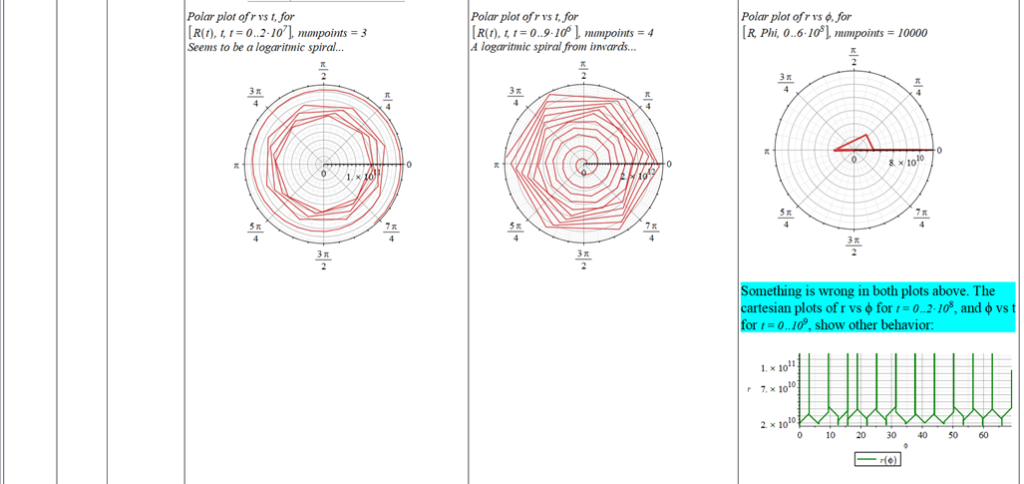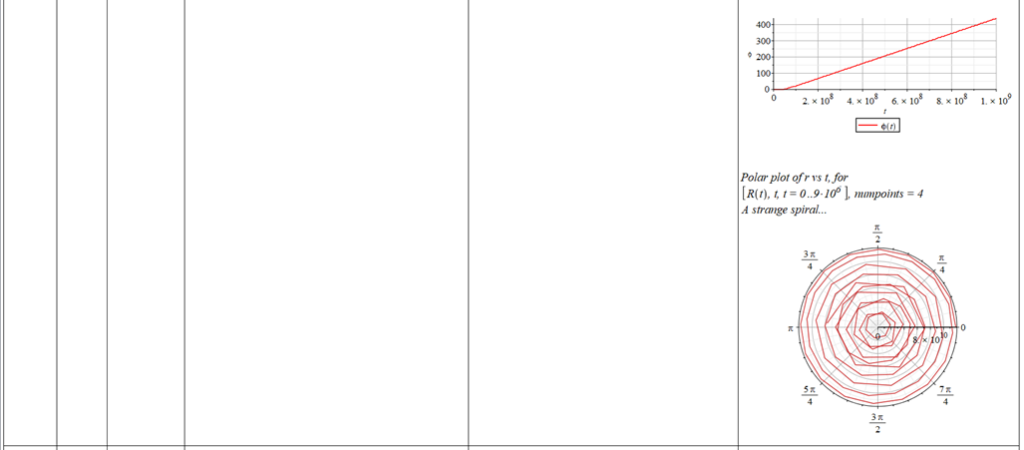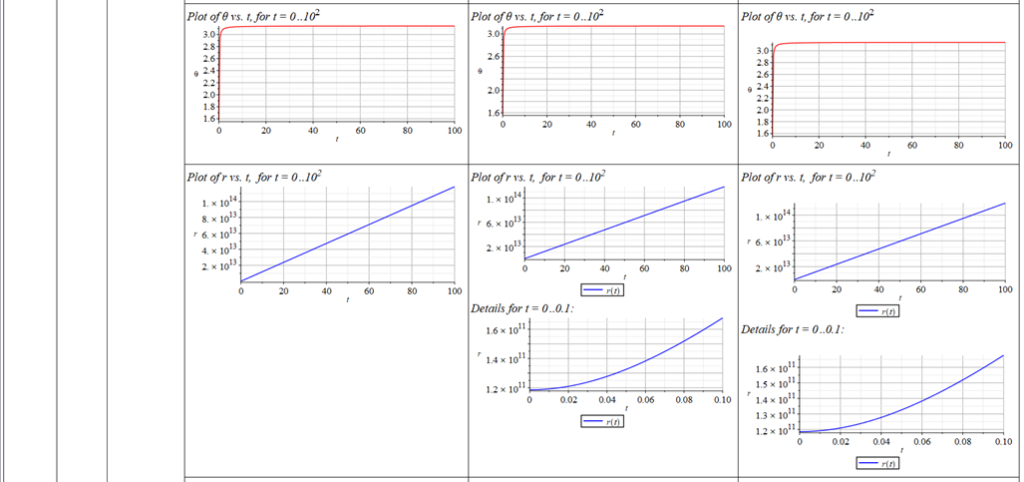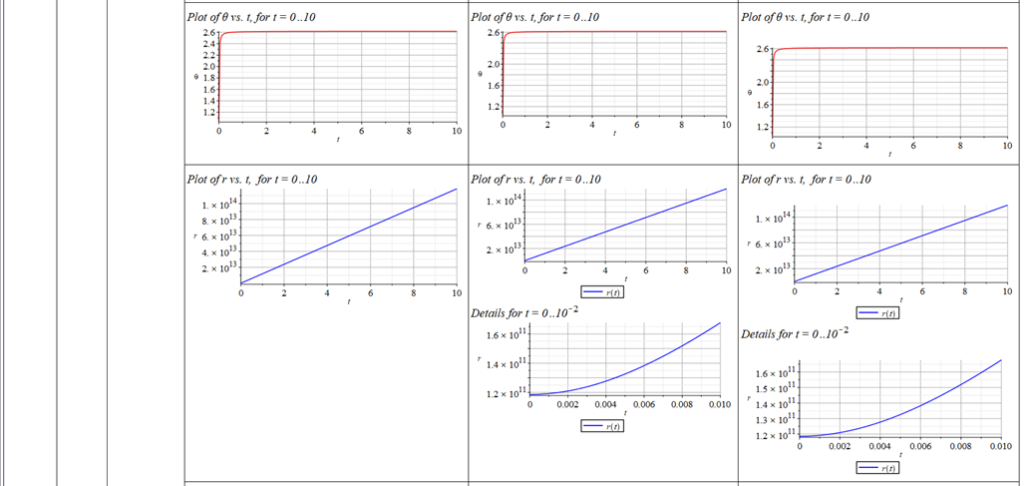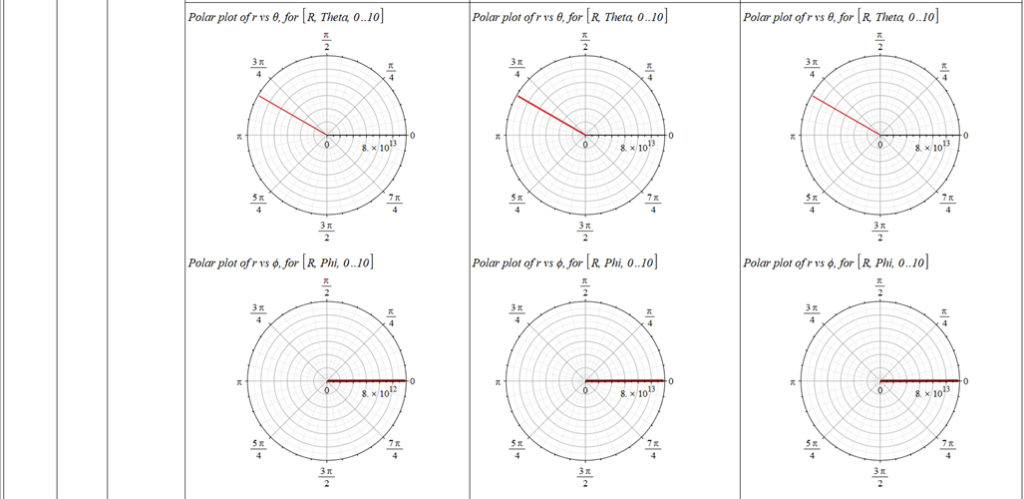
All plots and details of the results for r(0) = 1.186071579 1011 [m]
Analysis and plots of the motion for an initial distance of r_{(0)}=1.186071579\ {10}^{11}\left[m\right], and the following initial conditions and parameters:
| G=6.67408\ast{10}^{-11}\ \frac{Nm^2}{{\rm Kg}^2} | (the universal gravitational constant) |
| M=2\ {10}^{30}\ Kg | (the mass of the Sun) |
| m=5.9\ {10}^{24}\ Kg | (the mass of the Earth) |
| {\dot{r}}_{(0)}=0\ [m/s] | (linear velocity of the center of mass m at t=0) |
| \emptyset_{(0)}=0\ [rad] | (azimuthal position of the center of mass m at t=0) |
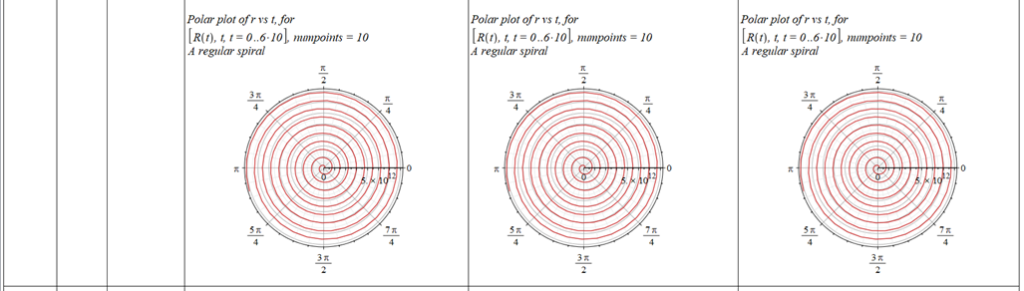
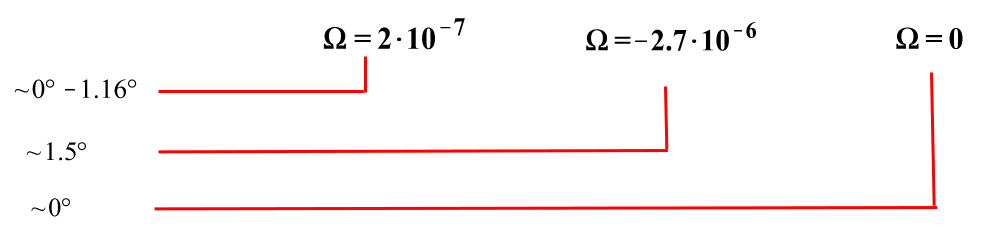
| {\dot{\emptyset}}_{(t)}=\Omega | (is the relative angular velocity between the spin of the center of mass M and the translation of the center of mass m) |
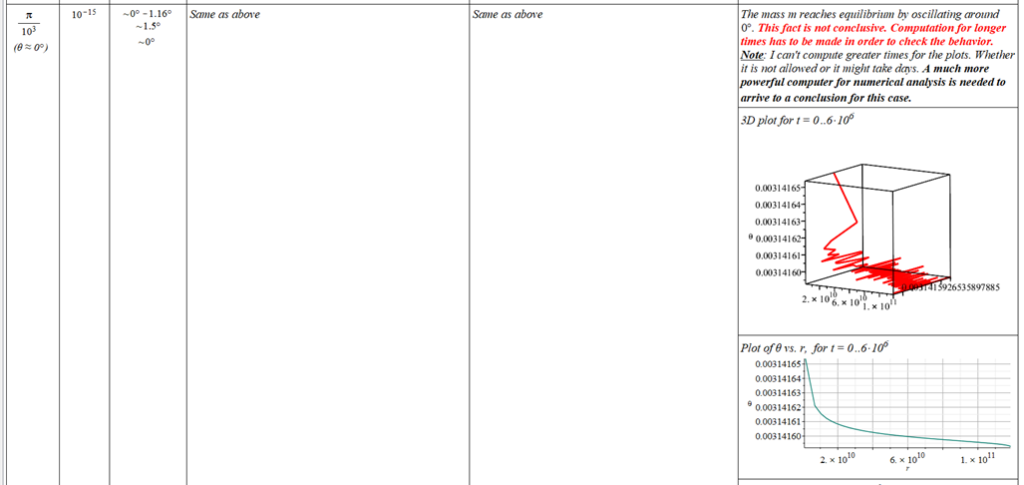
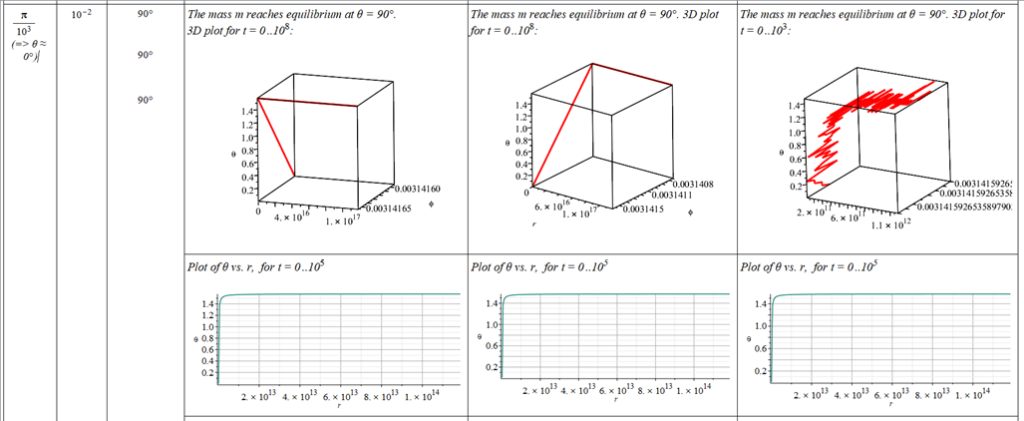
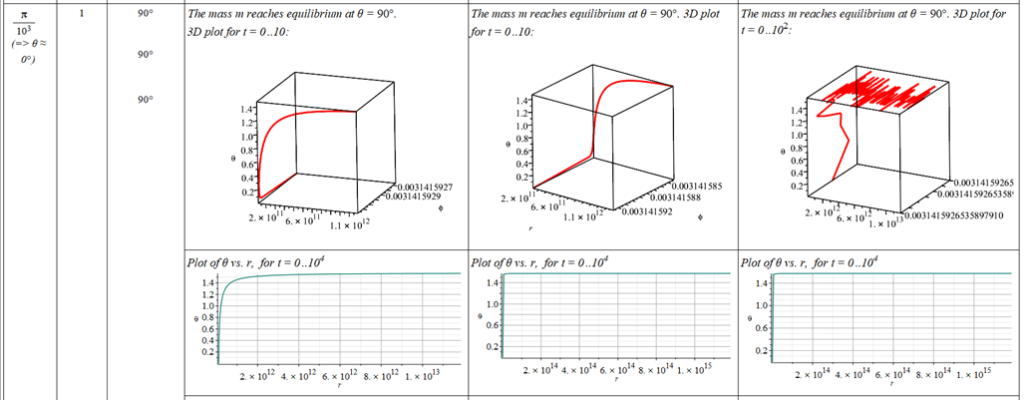
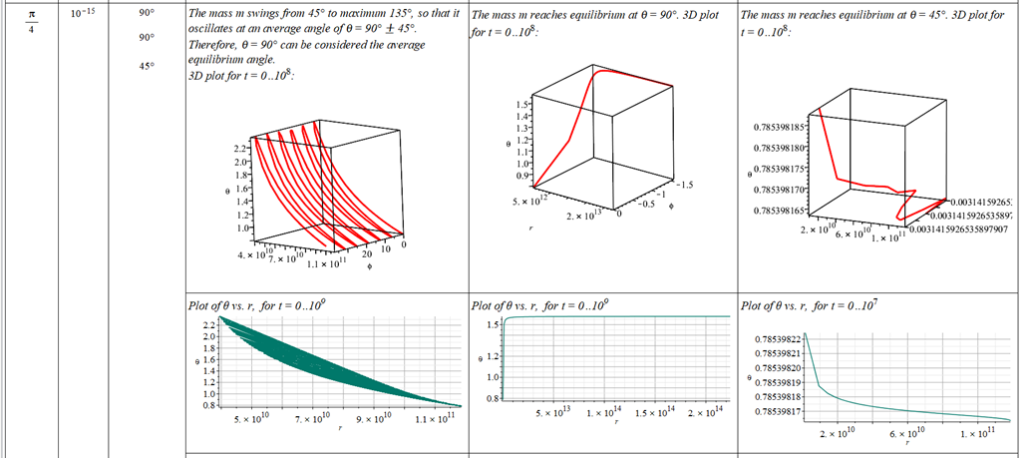
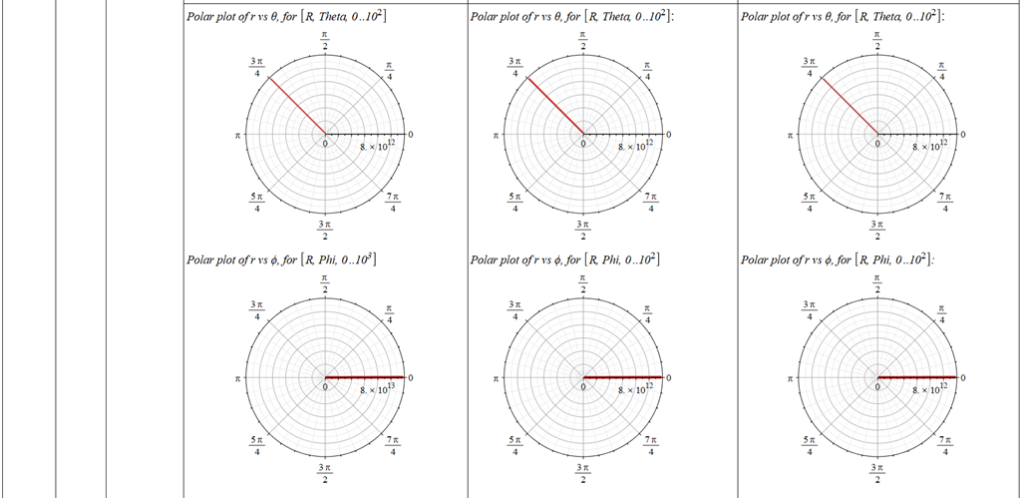
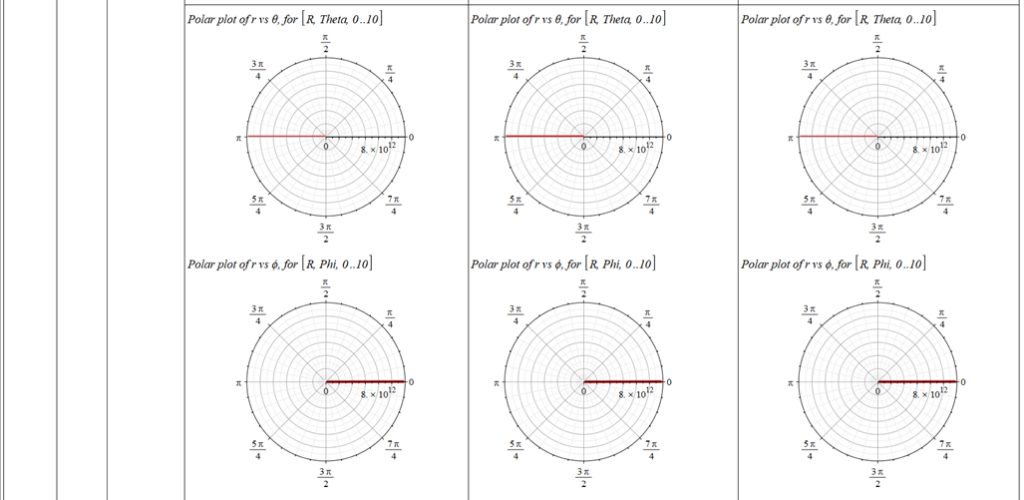
Since there is a singularity for \theta=0, the “zero” initial condition of the polar angle was taken close to zero as \theta=\frac{\pi}{{10}^3}\ [rad]. | |
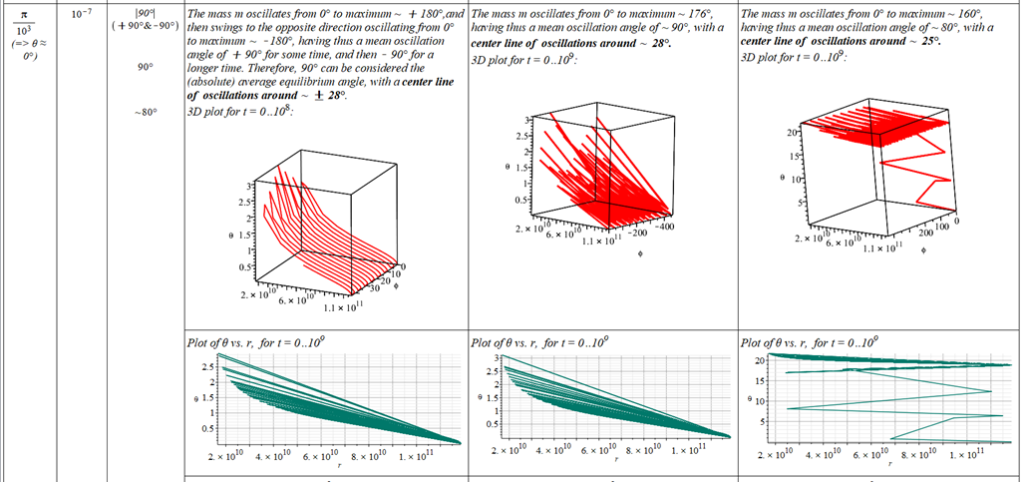
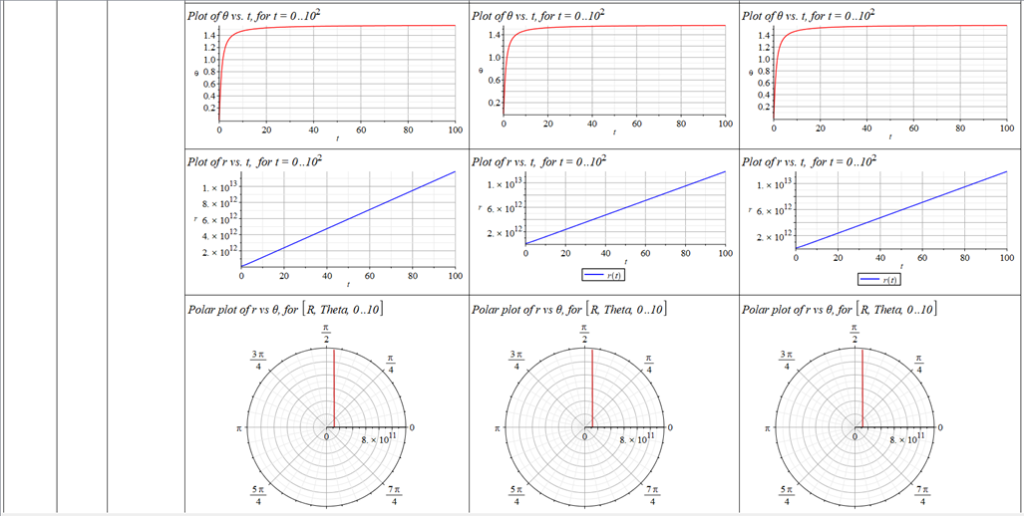
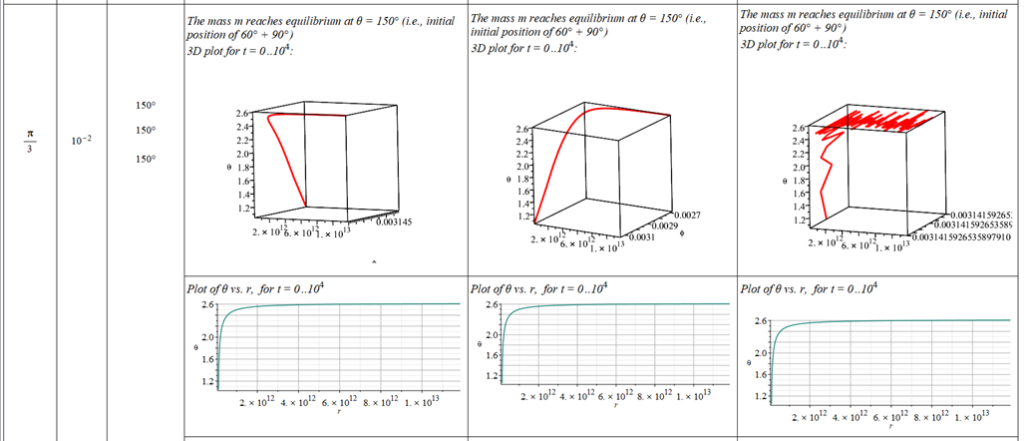
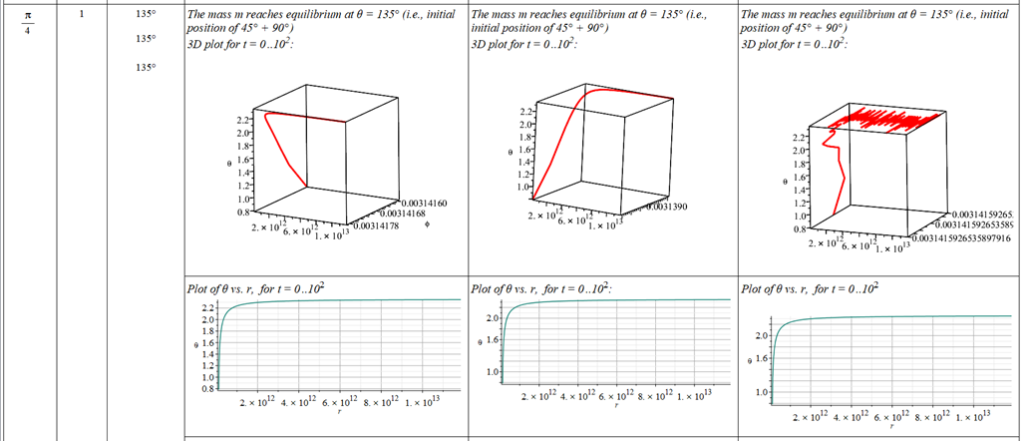
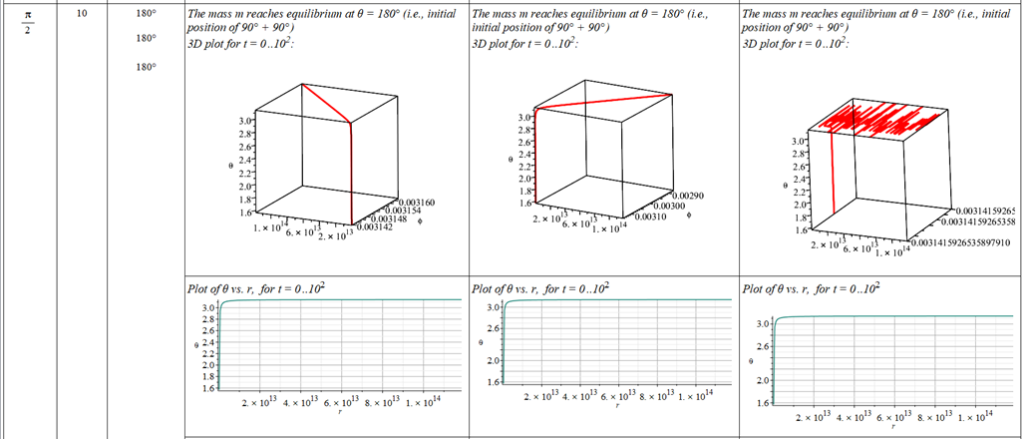
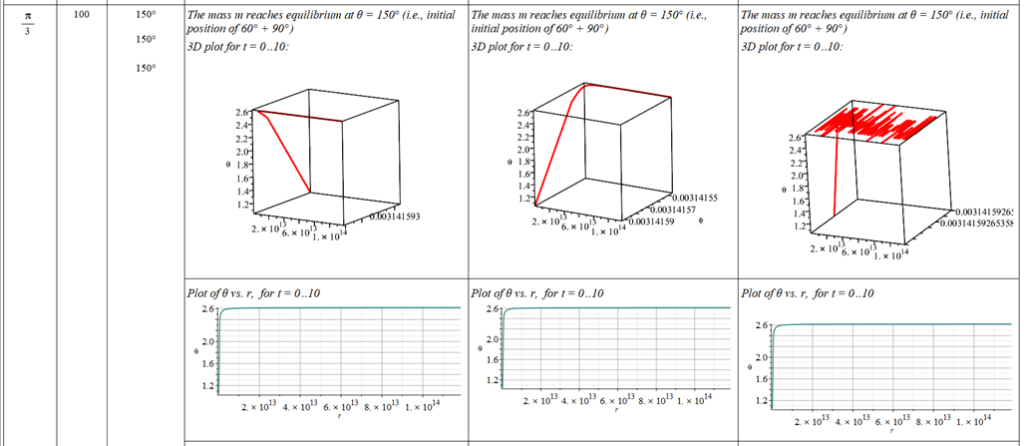
The polar angle of equilibrium (\theta_f) is found for several values of the initial conditions of \theta_{(0)}, \omega_{(0)}, and \Omega. The three vertical values of \theta_f on each table cell, from top to bottom, are the results for each of the three values of from left to right. For example:
Obs.: the table is very long, and it is split over into several images (misaligned gaps between images are easy to note).
Go to Table 1 to see the summary of the results obtained here.